Policy Brief #34, October 2023. Recent net-zero pledges could take the world a long way towards meeting the Paris climate goals, but an ambition gap remains.
One of the leading efforts to answer this question is through the Exploring National and Global Actions to Reduce Greenhouse Gas Emissions (ENGAGE) Project. Within ENGAGE, a collaboration of international groups is calculating how national policies would affect global emissions. Their main findings are:
- Neither current policies nor existing nationally determined contributions (NDCs) come close to the Paris goals. At best, current policies stabilize greenhouse gas emissions, whereas a deep cut is needed.
- Recent net-zero targets are a big step forward. These pledges, announced by several countries before and during COP26 in Glasgow, would bring global emissions down to a much lower level than current policies or NDCs.
- They are, however, still not enough to meet long-term climate goals.
- To close the remaining gap we must cut fossil fuels sharply, and further extend the reach of renewables.
- The optimum mix of mitigation approaches differs a lot for each country, with varying combinations of solar, wind, biomass, hydro, geothermal, carbon capture, as well as wave and tide power.
The Paris Agreement aims to limit the increase of global mean temperature to well below 2°C and preferably 1.5°C. It requires countries to set their own nationally determined contributions (NDCs) which include emissions targets to 2030, as well as plans of action to achieve those targets. Many nations have also set their own longer-term goals, notably the net-zero targets for mid-century, proposed before and during the Conference of the Parties (COP26) in Glasgow in 2021.
The crucial question is, how close do these ambitions take us to the Paris goals? One aim of the ENGAGE project is to help answer this question.
The process is more complex than simply adding up promised emissions. For a start, many countries do not have targets beyond 2030. Even where mid-century netzero pledges exist, they do not specify the emissions pathway that will be followed to reach that target. Integrated assessment models are therefore useful to calculate plausible emissions pathways, and show which technologies and other mitigation options are most likely to minimize cost.
To plot global emissions, the consortium uses several different integrated assessment models, which take into account economics, industry, land use, and other global systems. The models calculate likely emissions and climate effects over time, given a particular set of policies or other assumptions.
Seven futures
Each global model in the project has tackled seven broad scenarios:
2°C and 1.5°C scenarios: models calculate global cost-optimal ways of meeting these temperature goals in 2100, ignoring all stated policy.
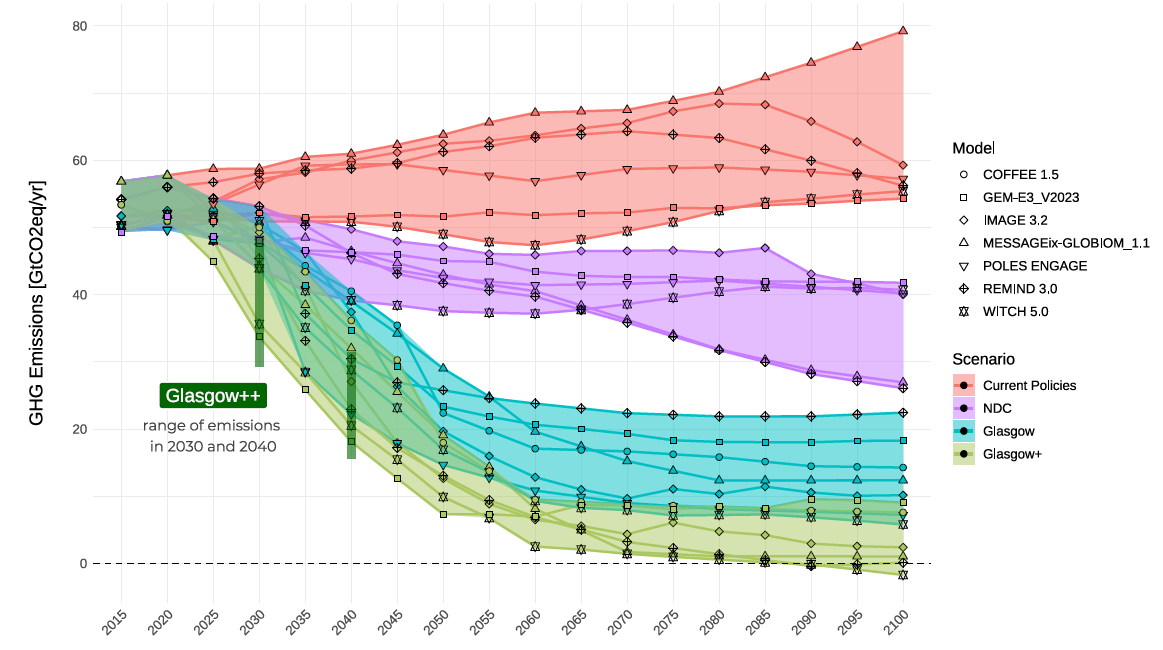
Current policies: assuming all climate policies that are already implemented. Results show global emissions continuing to climb (Figure 1), with warming projected to be around 3.3°C at the end of the century.
NDC scenario: fully implementing all NDCs to 2030, with ambition levels remaining constant after that1. This leads to warming of around 2.7°C, still substantially above the Paris goals. Note that emissions under current policies are far above these NDC projections, revealing a clear implementation gap.
Glasgow scenario: fully implementing NDCs and the net-zero pledges announced by the end of COP26. All models show that this is more ambitious than NDCs, with a much lower global emissions pathway. However, this still doesn’t meet the Paris goals, with models projecting end-of century warming in this scenario of around 2.1°C.
Glasgow+ scenario: fully implementing the net-zero pledges announced by the end of COP26 and expanding their coverage to all countries. For countries that currently do not have established a net-zero strategy, the assumed net-zero target year is calculated based on their income level. Expanding the coverage of net-zero pledges to all regions worldwide leads the GHG emissions trajectory to go below the 2°C target (warming of around 1.6°C).
Glasgow++ scenario: this scenario builds on the Glasgow+ scenario but moves the net-zero target year for each region forward by 5-10 years. Moving the target forward drives steeper emissions reductions in the short-term, aligning their trajectory with the 1.5°C target
 © IIASA
Figure 1. Global emissions pathways for the four scenarios, each according to seven different models Greenhouse gas emissions are shown in billion tonnes of CO2 equivalent per year.
Closing the gap
The gap between the Glasgow scenario and 2°C is small, but bear in mind that the Paris goal is to limit warming to well below 2°C. The results show that it should be feasible to close the gap between Glasgow and 1.5°C by increasing national and global ambition, expanding the coverage of net-zero pledges by more countries committing to net-zero emissions and anticipating climate action.
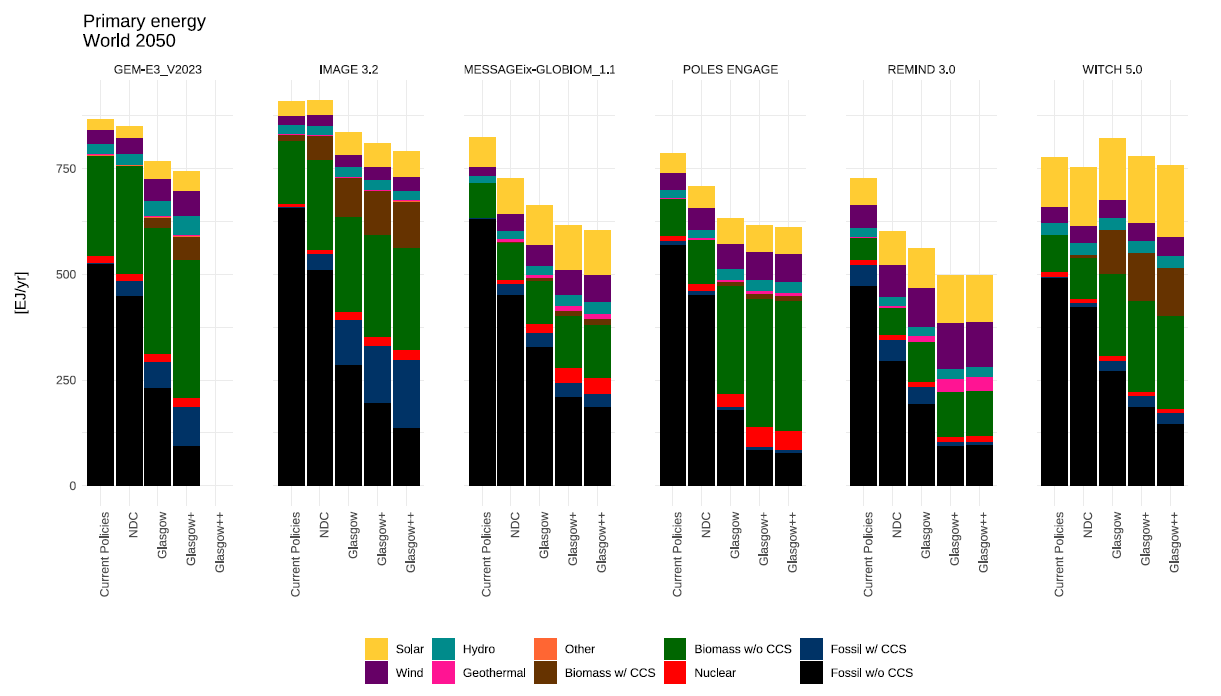
The Glasgow++ scenario modelled here would require phasing out coal, and a rapid cut in oil and gas, as well as further expanding the use of renewables. Existing net-zero pledges imply that renewables should meet around 40-45% of global primary energy in 2050. Meeting 1.5°C would require that share to grow to 50-75%.
Some models show other technologies playing a role, notably fossils with carbon capture and storage (CCS), wave and tidal power, and nuclear. Global projected energy balances are shown in Figure 2.
A crucial question is how to distribute this extra effort between countries. The ENGAGE project has also investigated various ethics-based schemes for effortsharing (described in Policy Brief 35).
 © IIASA
Figure 2. Global primary energy mix in 2050 for each scenario and models.
Contrasting strategies
Actually achieving net-zero targets will require nations to move to more sustainable energy and land systems. ENGAGE has developed a standardized framework for national modeling to provide a fair assessment of each country’s cost-optimal mitigation strategy.
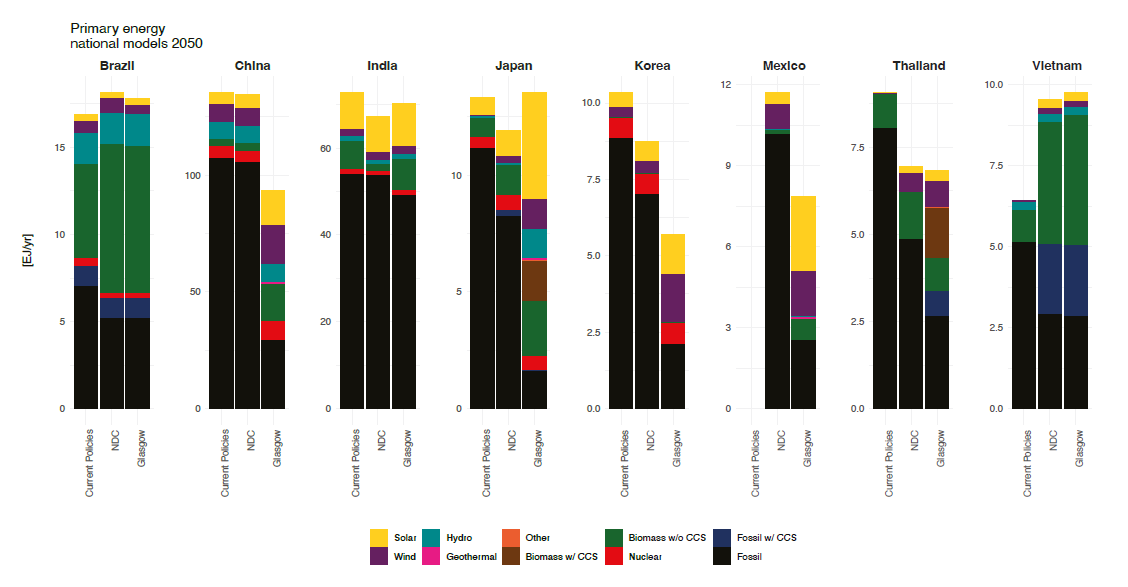
These national models project very diverse approaches, depending on local economics and renewable resources. For instance, Japan combines large reductions in the use of oil and gas with strong investment in solar, biomass, and wind. China achieves net-zero emissions by heavily reducing coal use and spreading investments across a wide range of low-carbon solutions, including nuclear and CCS, as well as renewables. Brazil, Vietnam, and Thailand, with higher shares of land available, increase use of biomass. Thailand and Korea continue to use a lot of oil.
 © IIASA
Figure 3. Primary energy mixes in 2050 for selected countries.
Stand and deliver
This work shows that recent net-zero pledges could be a big step towards meeting the Paris goals, as long as governments deliver the promised cuts. To actually meet those climate goals, global ambition on fossils and renewables must be increased further – perhaps through international cooperation and by more countries standing up to commit to net-zero and increasing efforts to bring climate targets forward in time
References and useful resources
ENGAGE: www.iiasa.ac.at/projects/engage
The research for this brief was led by Isabela Schmidt Tagomori, Michel den Elzen, Detlef van Vuuren (PBL Netherlands Environmental Assessment Agency), Fabio Amendola Diuana and Roberto Schaefer (COPPE). The work was published in an internal report to the European Commission in June 2023.
This project has received funding from the European Union’s Horizon 2020 research and innovation programme under grant agreement No 821471 (ENGAGE).
Disclaimer: the contents of this Policy Brief do not represent the opinion of the European Community nor is the European community responsible for any use that might be made of the content appearing herein.


