




The Indicators of Global Climate Change (IGCC) dashboard presents the latest evidence on emissions, warming, and other changes across the climate system in an accessible visual format. This is the first year that the climate dashboard has been maintained by IIASA, with the support of the Copernicus Climate Change Service.
The dashboard is the interactive companion to the annual Indicators of Global Climate Change assessment. The assessment updates key climate indicators between major reporting cycles of the Intergovernmental Panel on Climate Change (IPCC), while the dashboard makes the findings and underlying data easier to explore.
The annual assessment follows the methods of the IPCC Sixth Assessment Report and involves many of the same scientists. However, it is an independent scientific initiative, not an official IPCC product. Rather than reassessing the science, it tracks how the indicators change over time.
Published in 2026, the 2025 edition is the fourth annual update. It covers 12 sets of indicators, including greenhouse gas emissions, observed and human-induced warming, Earth’s energy imbalance, and the remaining carbon budget. It also tracks sea-level rise, marine heatwaves, land temperature extremes, and precipitation.
The dashboard presents these indicators as a narrative that begins with greenhouse gas emissions from human activities. These gases can remain in the atmosphere for decades to millennia. In 2024, total human-caused emissions reached a record 56.8 gigatons of carbon dioxide equivalent (Gt CO₂e). The dashboard then traces their effects, from rising atmospheric concentrations and changes in Earth’s energy balance to global warming and its wider impacts.
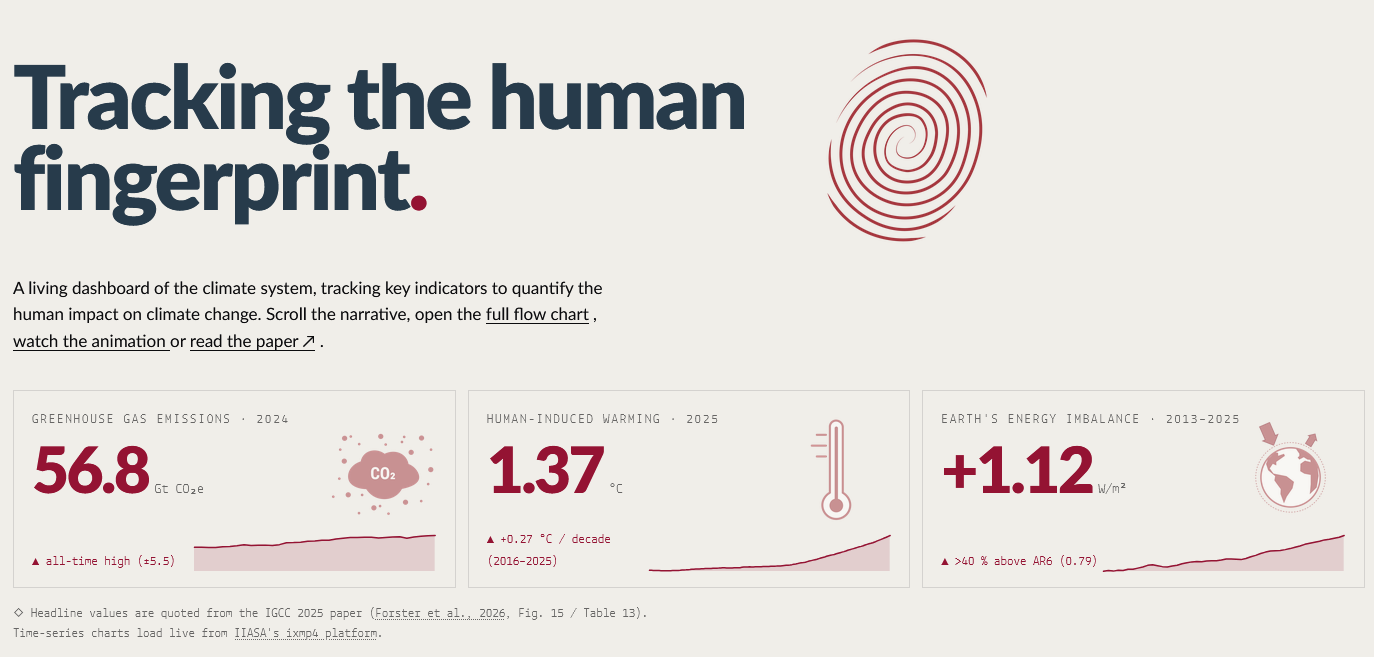 © Source: indicators.climate.copernicus.eu/
“Our focus was on making the links between the indicators clear,” says Daniel Huppmann, IIASA senior researcher and a member of the dashboard team. “The interactive format allows users to follow the climate story from emissions to impacts and explore the data behind each step.”
The dashboard turns the assessment’s central flow chart into a guided, scrollable narrative. Five sections – Emissions and Concentrations, Energy and Forcing, Warming, Climatic Impacts and Drivers, and the Carbon Budget – guide users from the causes of climate change to its physical effects.
Users can explore the underlying data, watch a short explanatory animation, and follow links to the scientific sources. This is particularly useful for policymakers and analysts working on climate strategies and assessments, as well as researchers, journalists, and educators who need current and clearly presented evidence.
The peer-reviewed assessment remains the authoritative source, and every figure can be traced to the paper or supporting dataset. The data and code are available for reuse under a Creative Commons Attribution 4.0 licence.
The dashboard is maintained by an interdisciplinary IIASA team comprising Daniel Huppmann, Pino Mussak, Chris Smith, and Marco Zecchetto.
Climate policy cannot rely only on assessments published several years apart,” concludes Smith. “These annual updates give policymakers consistent evidence on the pace of warming, emissions, and the remaining carbon budget.”
References
Forster, P. et al. (2026). Indicators of Global Climate Change 2025: annual update of key indicators of the state of the climate system and human influence. Earth System Science Data. doi.org/10.5194/essd-18-3889-2026 ↗
Smith, C. et al. (2026). Indicators of Global Climate Change 2025 [data set]. Zenodo. doi.org/10.5281/zenodo.20600829 ↗
News

16 October 2026
Getting back on track to reduce methane emissions
A new study, led by IIASA researchers and coauthored by UNEP colleagues, finds that if governments fully implement their methane reduction plans, they could reduce global emissions by 11% between 2020 and 2030. This would reverse the current trend of increasing methane emissions, but would not be sufficient to achieve the goal of the Global Methane Pledge.

06 October 2026
Nanjing University delegation visits IIASA to explore future collaboration
A high-level delegation from Nanjing University (NJU), led by Professor Tan Zhemin, President of NJU and Fellow of the Chinese Academy of Sciences, visited IIASA to discuss opportunities for strengthening scientific cooperation and advancing joint research on global challenges.
21 September 2026
Fairness informs how the world cuts emissions
Who cuts emissions fastest, and who supports others do so, are central questions in global climate action. New IIASA-led research shows that building fairness into climate models from the start can inform deliberations without changing the overall climate goal.